One of the most important aspects of using social media revolves around how people use it.
To produce valid social media analytics we first have to define social media:
Social media is not a simple or clear cut tool. It is a very basic and adaptable cog that fits into personal and professional needs. If we think about social media as a nebulous category, the ability to track points of impact that affect our audience become clouded by buzz words and gaps in knowledge.
We could say that social media is ‘all things to all people’ or that include includes the whole world wide web. In some conversations these statements could be correct.
In the business conversation these statements are merely red herrings that obfuscate the problem.
To help fix our murky view of social media we need to break down some core questions of who we are trying to impact… and understand where our market place is heading.
Core User Questions
- who is using it
- when are they using it
- why are they using it
- what hardware do they use
- what need does it solve
- what motivates them to use it
We also need to think of the business drivers that actually control return on investment (ROI) and where efficiency savings are located within our business process.
Step One: Stop thinking social media is free
Everyone who thinks it is ‘free’ is throwing away some of the most valuable business intelligence they could ever have. The lost opportunity of having ‘free’ associated to your understanding of online business has cost you untold revenues and savings.
In the long run social media takes tremendous amounts of time, budget, strategy, and planning to accomplish very specific campaigns. The core obstacle of scaling social media efforts is that it relies on a social component within a population of users. This social component is often very fickle. The best social media campaigns locate specific aspects of an audience that address six core user questions and locate trends that have an on-going or repetitive cycle (i.e., they have identified themselves as not be ‘fickle’)
By answering these questions and applying them to the market, we can begin to create functioning social media analytics that make sense for our business.
Step Two – Analyzing Trends and Cycles
Persistent Trends
These are often called mega trends; when there is a massive social adoption and word-of-mouth promotion of some underlying need.
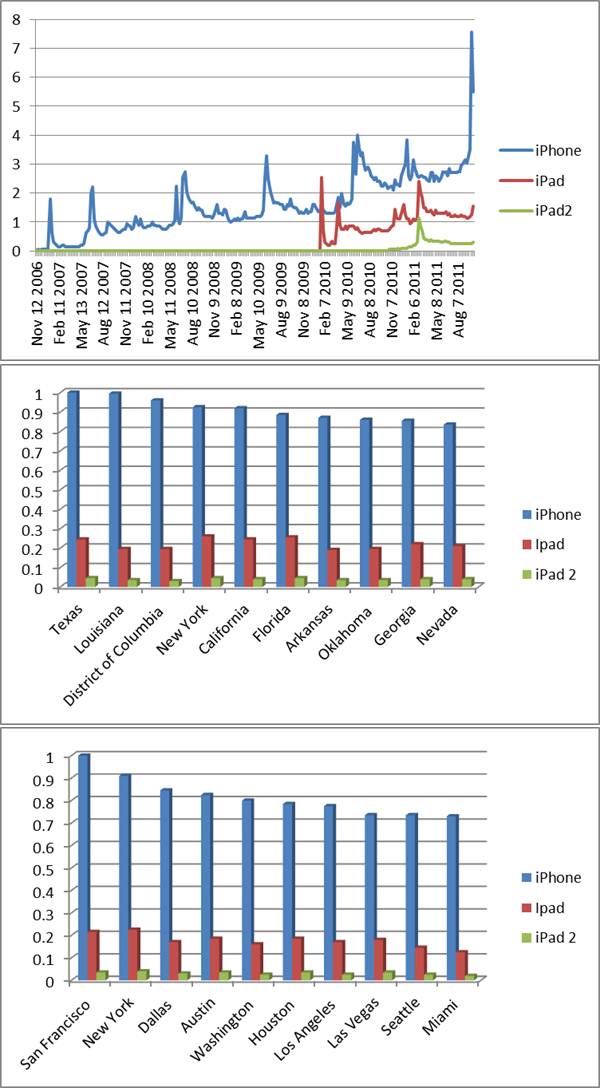
In simple examples you could look at things like “being environmentally friendly” gaining traction from 1990 to 2011. You could also look at the Apple product market and see a continually moving need to purchase iPhones.
In the social space itself, large trends like the adoption of Facebook and Twitter are easy to see from 2005 to today.
While the above examples are pretty big, it isn’t necessarily required that an mega trend last years and years.
Some trends last weeks or months and eventually die off (never to be seen again.)
Think about where you fall into the mix
If you are interacting with a mega trend, you need to wisely choose where your point of interaction is going to occur.
The biggest benefit of a mega trend is also your biggest weakness: you can tactically ride the wave or you can be crushed beneath it.
If you don’t have the critical budget needed to affect the mega trend at the top level, you need to strategically plan where and when you’ll be interacting with it.
iPhone, iPad, and iPad2 example
Unless you have a massive budget and a great idea, going head to head with Apple’s tidal wave of marketing and social adoption is a pretty futile approach.
If we drill down to specific geographic areas we can tactically decide where to win our victories.
The following charts show a breakdown of the search volumes and demand for iPhone, iPad, and iPad 2.
If we were a competing product or an iPad accessory, the 3rd chart shows us the top ten cities where we can potentially engage without spreading ourselves too thin.

Repetitive Cycle
If you’ve ever seen a EKG or heart monitor, you know what I’m talking about.
Repetitive cycles are an ideal ground for social media analytics because they represent an opportunity to analyze the spikes, predict when the next one will occur, and strategize a tactic for when you want to interact with it.
The great part about repetitive cycles are that they are literally everywhere.
The bad part about repetitive cycles are they happen like clockwork, so if you don’t have your act together you will miss the opportunity.
While some repetitive trends require some expert forecasting, there are many scheduled industries that have repetitive cycles.
American Idol example
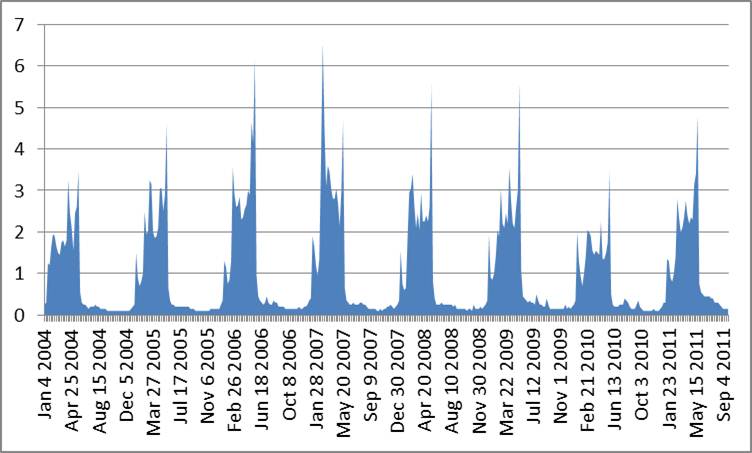
The chart below shows the hit series American Idol from 2004 through today.
Each season has a nearly identical set of promotions, viewer adoption, and industry events. Each season can be analyzed to detail specific events that built up an on-going promotional buzz, followed by smaller interest spikes when news events such as judges quitting or contestants left occurred.

Choosing your Mega and Repetitive Trends wisely
The Social Media Impact Point
This is where strategic planning and tactical execution collide, when the proverbial ‘rubber meets the road.’
Being successful in a market requires an understanding of the effort required, the amount of traction gained, and the speed of which you can accelerate.
This requires a business to tactically execute against a market trend that overlaps with business capability to engage with that trend.
As a tool social media allows us to engage at an almost infinite number of points. The initial conversation that serves as a launching point into the next wave needs to be timed against the actual velocity of the wave. If you can’t devote enough effort or control to stay on top of the wave, you need to wait until another wave comes by.
You also need to know what a ‘really sweet wave’ looks like.
Even mega trends have ups and downs, and your team or equipment may not be up to par for trying to ride the tsunami.
If you business model has trouble accelerating and compensating for peaks and lulls, you’ll probably want to find a calm uptrend that your team can manage and monetize appropriately.
An example with shoes…
Assume we sell shoes…

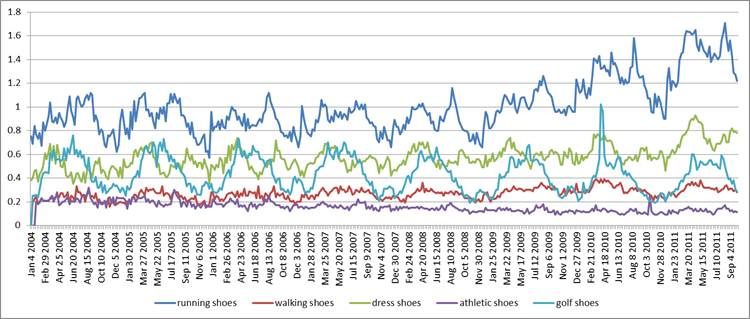
We can see from 2004 to 2011 that running shoes (in blue) is going up year after year. On a yearly basis it also has some pretty hefty ups and downs. As a business owner, if I am trying to maintain a constant workforce and inventory with consistent sales I’ll be hard pressed to keep my monthly payroll and production capacities evenly matched without spending a hefty budget on warehousing and pre-order manufacturing.
If I want a very consistent yearly business, my two choices are walking shoes and more general athletic shoes… but walking shoes has a slight yearly increase compared to the slight yearly decrease of athletic shoes.

Comments are closed.